

Google Ads wins when people are already searching for what you sell. Facebook, now under Meta, wins when you need to put your product in front of people who haven’t started looking yet. That’s the whole decision in one sentence: Google captures demand, Meta creates it, so match the platform to where your buyer actually stands in their journey.
Here’s the fast version, broken down by situation:
- Local services, B2B, high-intent products → lead with Google Ads. Someone typing “emergency plumber near me” is ready to buy.
- Visual products, DTC brands, new launches → lead with Meta. Nobody is searching for a product they don’t know exists yet.
- You have the budget for a full funnel → run both. Meta builds awareness, Google catches the search traffic that awareness creates.
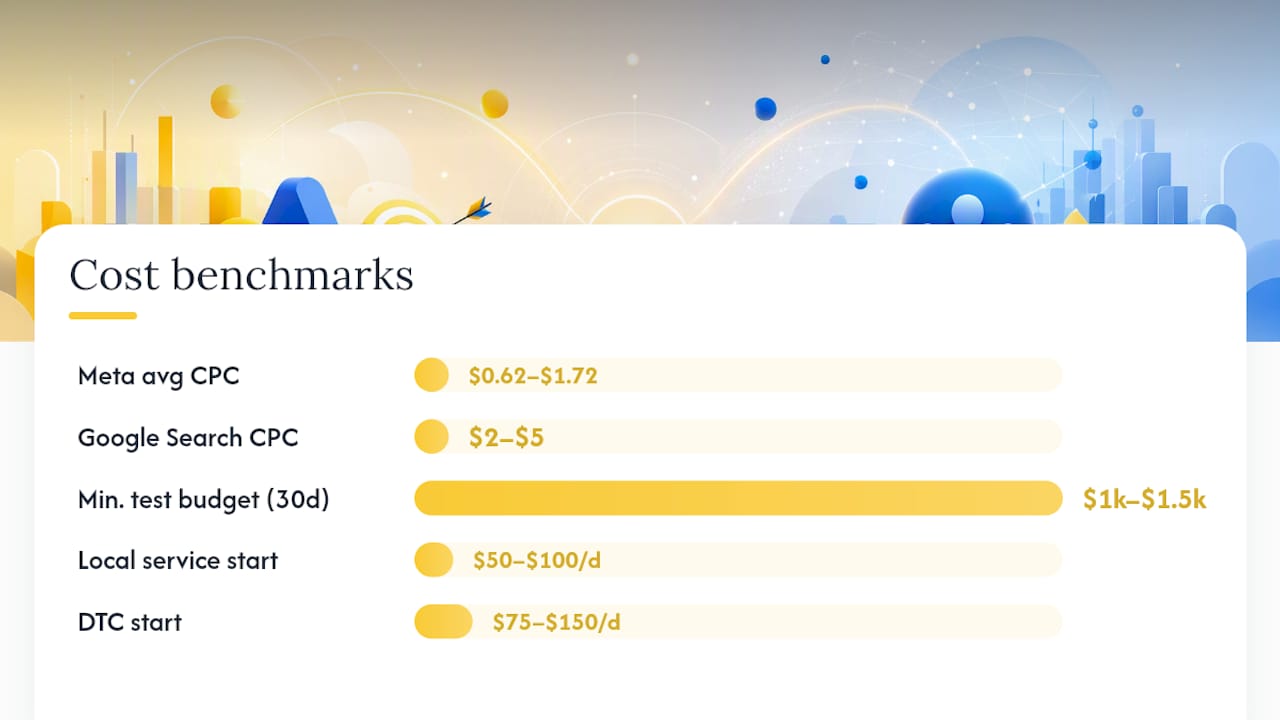
Cost data backs this split up but with a catch worth flagging early: Meta’s average CPC tends to run $0.62 to $1.72, while Google Search CPCs commonly land between $2 and $5. That gap makes Google look expensive on paper. It usually isn’t, once you measure cost per acquisition instead of cost per click, because search traffic converts at a higher rate than cold social traffic.
Your next move: pick one platform based on your buyer journey, set a four-week test budget, and track CPA and ROAS from day one, not clicks.
Key Takeaways
Winning the Google Ads versus Facebook Ads decision means matching platform choice to buyer intent and judging every dollar by CPA and ROAS, not click price.
| Point | Details |
|---|---|
| Match platform to intent | Use Google for buyers already searching; use Meta to create demand among people who aren’t looking yet. |
| Ignore CPC, track CPA/ROAS | A cheaper click means nothing if it converts at a lower rate; compare cost per acquisition instead. |
| Start with a business-type split | Local services lean 70 to 80% Google; visual DTC brands lean 70 to 80% Meta, then adjust from data. |
| Fix tracking before scaling | Set up server-side conversion tracking and run quarterly incrementality tests to avoid inflated numbers. |
| Get a professional audit | Envisionmarketingagency audits search volume, creative capacity, and tracking setup before recommending a budget split. |
Table of Contents
- Google Ads vs Facebook Ads: A Side-by-Side Comparison
- How Do Google Ads and Facebook Target the Right Audience?
- What Ad Formats and Creative Actually Work on Each Platform?
- Which Platform Costs Less: Google Ads or Facebook Ads?
- How Do You Track Conversions Accurately Across Both Platforms?
- How Should You Split Your Ad Budget Between Platforms?
- When Should You Run Google Ads and Facebook Ads Together?
- How Does Envision Marketing Agency Decide Which Platform to Use?
- What Other Marketing Tools Should Connect to Your Ad Platforms?
- What Mistakes Do Businesses Make Choosing Between Google Ads and Facebook Ads?
- Why Budget Allocation Beats Platform Loyalty
- Get a Data-Driven Ad Platform Audit From Envisionmarketingagency
- Frequently Asked Questions
- Sources
Google Ads vs Facebook Ads: A Side-by-Side Comparison
Six factors decide which platform earns your first dollar: use case, targeting method, creative role, cost shape, speed to convert, and how easy the results are to measure.
Best for / use case. Google wins for anything with clear search intent, plumbers, lawyers, SaaS with known category terms, B2B services people actively research. Meta wins for products that need to be seen before they’re wanted: apparel, home goods, subscription boxes, anything impulse-driven or visually compelling.

Targeting. Google matches ads to what someone typed, plus contextual and audience signals layered on top. Meta matches ads to who someone is and how they behave, then extends that with lookalike modeling. One is intent-based. The other is identity-based.
Creative role. On Google Search, the ad copy supports the click, but the landing page does the real work. On Meta, the creative is the targeting. A weak image or video simply won’t get shown to the right people, no matter how tight your audience settings are.
Cost shape. This is where most comparisons go wrong. Facebook’s lower CPC range of roughly $0.62 to $1.72 against Google’s $2 to $5 makes Meta look like the cheaper option every time. But a $2 click that converts at 6% often beats a $0.70 click that converts at 1%. CPA and ROAS are the only numbers that matter for a cross-platform call.
Speed to convert. Google tends to convert faster because the searcher already has intent. Meta usually needs more touches, an impression, a scroll-stop, maybe a retarget, before someone buys.
Attribution. Google’s conversion tracking maps cleanly to a click-to-purchase path. Meta’s attribution gets murkier because it credits view-through and multi-day windows that can inflate reported performance if you’re not careful.
Three decision rules you can apply today:
- If your core product terms show real monthly search volume, prioritize Google first, that demand is sitting there waiting.
- If your product needs to be seen to be understood or desired, prioritize Meta, no one searches for something they don’t know exists.
- If you have at least $3,000 to $5,000 a month to test, split it and let 60 days of CPA data tell you where to shift the balance, rather than guessing up front.
A 2024 platform comparison from Groas frames this the same way: Meta for discovery and testing product-market fit, Google for capturing intent that already exists.
How Do Google Ads and Facebook Target the Right Audience?
The two platforms don’t just target differently, they’re solving different problems entirely.
Google reads what someone is doing right now. A search query is a live signal of intent: “best CRM for small teams” tells Google exactly what category, and often what buying stage, that person is in. Layer on top of that the searcher’s location, device, and past behavior, and Google can serve an ad to someone who is, functionally, already halfway through your sales funnel. This is why Google dominates for local intent and in-market shopping.
Meta reads who someone is. It builds a profile from demographics, interests, page interactions, and, critically, lookalike modeling based on your existing customers. You upload a list of your best buyers, and Meta finds thousands of people who resemble them statistically. That’s powerful for prospecting cold audiences who’ve never heard of you, but it can’t read intent the way a search query can.
Here’s a practical checklist for mapping your own data to the right platform:
- Pull your customer list first. Export your highest-value customers (by lifetime value, not just recent buyers) before building any Meta audience, this is your lookalike seed.
- Audit your keyword volume. If your product category has decent monthly search volume on terms with clear commercial intent, that’s your signal to prioritize Google.
- Start broad on Meta, not narrow. Meta’s algorithm, especially with strong creative feeding its detection engine, often outperforms manually narrowed interest targeting once it has enough conversion data to learn from.
- Layer retargeting on both platforms. Anyone who visited your site but didn’t convert should see you again, on Google through Display remarketing, and on Meta through a custom audience pulled from your pixel or Conversions API.
- Test one broad audience against one narrow audience on Meta for at least two weeks before declaring a winner, the algorithm needs volume to optimize.
Pro Tip: Don’t seed a Meta lookalike audience with your entire customer list. Seed it with your top 20% by lifetime value, the algorithm finds better matches from a tight, high-quality seed than a broad, mediocre one.
What Ad Formats and Creative Actually Work on Each Platform?
Google Search ads are still just text: headlines, descriptions, and extensions competing for attention against other text ads. Google Shopping adds product images and price directly in results, which matters enormously for ecommerce. Neither format leans on flashy creative, they lean on relevance between the query, the ad copy, and the landing page.
Meta is the opposite. Feed posts, Reels, Stories, and carousels are built for a scroll, not a search bar, so the creative has to stop the thumb before it can sell anything. A carousel showcasing five products in motion will consistently outperform a static image ad with better copy but no movement.
That difference changes where you should put your production effort:
- On Google, spend your effort on the landing page, not the ad. A well-built, fast-loading landing page that matches the search intent will move your Quality Score and your conversion rate more than clever ad copy ever will.
- On Meta, spend your effort on video and motion. Static images still work, but Reels and short-form video consistently pull lower cost per result once the algorithm has data to optimize against.
- Treat your landing page as the shared asset. Whichever platform sends the click, the page needs to load fast and match the promise made in the ad.
Testing looks different on each side too. On Google, test one variable at a time inside a single ad group, headline against headline, so Quality Score data stays clean. On Meta, test full creative “bundles”, image or video, headline, and primary text together, because the algorithm evaluates the combination, not each piece in isolation. Give any Meta test at least 50 conversions per ad set before judging it; Google Search tests can often be read after two to three weeks of consistent impression volume.
Pro Tip: Build three creative concepts, not three variations of one concept, before launching a new Meta campaign. The algorithm needs genuinely different angles to find your winner, not three versions of the same photo shoot.
Which Platform Costs Less: Google Ads or Facebook Ads?
Neither, and that’s the point. Comparing raw CPC between the two is like comparing rent in two cities without asking what you get for the money.
Meta’s average CPC typically sits between $0.62 and $1.72, while Google Search CPC commonly runs $2 to $5. On the surface, Meta looks like the bargain. But a click on Meta usually comes from someone mid-scroll who wasn’t looking to buy anything, while a click on Google Search comes from someone who typed a specific need into a search bar. Comparing those clicks on price alone ignores the fact that they’re not the same kind of click.
The metric that actually tells you anything is cost per acquisition, and its counterpart, return on ad spend. Here’s the simple math behind break-even ROAS:
If your product sells for $100 and costs $40 to produce and fulfill, you have $60 of margin to spend on acquiring that customer. Spend $60 or less per sale, and you’re profitable. Spend $80, and you’re paying to lose money on every order until repeat purchases catch up, if they ever do. Your break-even ROAS is simply revenue divided by ad spend at the point where profit hits zero, in this case, 1.67x.
Once you know that number, CPC stops mattering. A $4 click that converts at 5% costs you $80 per sale. A $1 click that converts at 0.8% costs you $125 per sale. The “cheaper” platform just cost you more.
A few starter budgets worth knowing before you commit real money:
- Minimum viable test budget: $1,000 to $1,500 per platform over 30 days, enough to gather 20 to 50 conversions for a real read on CPA.
- Local service business: Start with $50 to $100 per day on Google, since search volume for local intent terms is usually the limiting factor, not budget.
- DTC or visual product launch: Start with $75 to $150 per day on Meta, split across two to three creative concepts, before scaling the winner.
- Scaling signal: Once CPA sits comfortably below your break-even ROAS threshold for two consecutive weeks, increase budget by 20% to 30% at a time, not all at once, to avoid resetting the algorithm’s learning phase.
Practitioner data from campaigns managing millions in spend backs up what the math suggests: platform performance depends heavily on business type, and the winner on cost per click is rarely the winner on cost per acquisition. Industry benchmarking guides consistently point back to CPA and ROAS as the only metrics that hold up across platforms.
How Do You Track Conversions Accurately Across Both Platforms?
Tracking is where good budget decisions go to die if you get it wrong. Both platforms will happily report inflated numbers if you let their default attribution windows do the talking.
Google leans on first-party conversion tracking through Google Tag Manager and, increasingly, server-side tagging to survive browser privacy changes. Meta relies on its Conversions API to send server-side event data directly, bypassing some of the tracking loss caused by ad blockers and iOS privacy settings. Neither platform’s dashboard number should be taken as gospel on its own.
Follow these steps to tighten up your measurement:
- Set up server-side tracking on both platforms. Browser-based pixels alone now miss a meaningful share of conversions due to ad blockers and privacy settings.
- Standardize your attribution window. Pick one comparable window (commonly 7-day click, 1-day view) and apply it consistently, so you’re not comparing a 28-day Meta window against a 30-day Google window.
- Run an incrementality test at least once a quarter. Pause one platform for a short window and watch whether total conversions actually drop, or whether that platform was just claiming credit for sales that would have happened anyway.
- Build a simple cross-platform reporting sheet. Track spend, conversions, CPA, and ROAS side by side weekly, not just what each ad platform reports in isolation.
A practitioner guide on conversion tracking setup walks through the server-side event configuration in more technical detail if you’re setting this up for the first time.
- Never trust platform-reported ROAS as your only source of truth, it tends to run optimistic.
- Cross-check against your actual revenue in your ecommerce platform or CRM monthly.
- Report CPA and ROAS to stakeholders, not clicks or impressions, those numbers don’t pay bills.
How Should You Split Your Ad Budget Between Platforms?
Your starting split should follow your business model, not a generic 50/50 rule that ignores what you actually sell.
- Local service businesses (plumbers, dentists, law firms): 70% to 80% Google, 20% to 30% Meta for brand awareness and retargeting.
- B2B lead generation: 60% to 70% Google for high-intent search terms, 30% to 40% Meta for LinkedIn-style prospecting alternatives and retargeting website visitors.
- Established ecommerce with brand recognition: 50/50 split, Google captures branded and category searches while Meta drives new customer acquisition.
- Visual DTC brands: 70% to 80% Meta, 20% to 30% Google for branded search and retargeting once awareness builds.
- New product launches: 80% Meta initially, shifting toward Google as search volume for your product name and category starts to appear.
These starting ranges track closely with practitioner-reported allocations from large-scale campaign data, which found similar splits performing well across comparable business categories.
Watch for three signals that tell you it’s time to reweight:
- CPA drifts upward on one platform for two consecutive weeks while the other holds steady, that’s your cue to shift spend toward the stable performer.
- Branded search volume climbs after a Meta campaign launch, a sign Meta is creating demand that Google should now be capturing.
- Conversion rate on one platform’s landing page traffic drops below your break-even threshold, fix the page before you fix the budget.
Impatience is the most common reason these tests fail to produce a clear answer.
When Should You Run Google Ads and Facebook Ads Together?
Running both platforms isn’t hedging your bets, it’s building a system where each one makes the other more efficient. Meta creates awareness that shows up later as branded search volume on Google, and Google converts that demand more cheaply than Meta could on its own because the searcher now already knows your name.
Here’s how the two typically pair in a working funnel:
- Meta prospecting campaigns introduce your brand to cold, lookalike-modeled audiences with strong video or carousel creative.
- Meta retargeting campaigns re-engage anyone who visited your site or engaged with the prospecting ads but didn’t convert.
- Google Search capture campaigns target your own brand name plus category terms, catching the demand Meta just created.
- Google Display remarketing mirrors Meta’s retargeting role for anyone who searched but bounced off your landing page.
Keep your landing page consistent across all four. Someone who clicked a Meta carousel and later searched your brand name on Google should land on a page that feels like the same offer, not a disconnected homepage. A disjointed funnel like that quietly kills conversion rate on both platforms at once. If you’re building this kind of full-funnel offer from scratch, structuring the funnel properly from the start saves you from rebuilding it later once you see where traffic drops off.
Two measurement checks matter once both platforms are live together:
- Track branded search lift in Google Ads and organic search console data during and after Meta campaign launches, that lift is your proof the platforms are compounding.
- Check audience overlap between your Meta custom audiences and your Google remarketing lists so you’re not double-counting the same person as two separate acquisitions in your reporting.
How Does Envision Marketing Agency Decide Which Platform to Use?
Every client engagement starts with the same question this article opens with: is this business capturing existing demand or creating new demand? That single question, more than any tool or benchmark, decides where the first dollar goes.
Envisionmarketingagency has worked with more than 550 clients since 2020, across professional services, ecommerce, healthcare, legal, and startup categories, and the pattern holds up consistently: businesses with clear local or category search volume get a Google-first allocation, while visually driven or discovery-dependent brands start weighted toward Meta.
A local legal client came in convinced Meta was the answer because “that’s where everyone spends time.” A quick search-volume audit showed steady monthly searches for their exact practice area, with almost no existing branded search. Shifting the initial split to majority Google, with Meta running lighter retargeting, cut cost per lead by roughly a third within the first two months. The fix wasn’t a new tactic, it was matching the platform to where the buyer actually was.
Before moving any budget between platforms, run this audit first:
- Search volume check: Do your core product or service terms show meaningful monthly search volume with commercial intent?
- Landing page readiness: Is the page you’re sending traffic to fast, relevant, and built to convert the specific offer in the ad?
- Creative capacity: Can you produce enough video and image variations to feed a Meta campaign without creative fatigue setting in within weeks?
- Tracking setup: Is server-side conversion tracking live and reporting accurately on both platforms before you spend a dollar?
What Other Marketing Tools Should Connect to Your Ad Platforms?
Ad platforms don’t operate in isolation, and the businesses getting the best return treat them as one piece of a connected system rather than a standalone spend line.
Your CRM should feed customer data back into both platforms. Google’s Customer Match and Meta’s Custom Audiences both accept uploaded customer lists, which lets you exclude existing customers from prospecting campaigns or build lookalikes from your best buyers rather than guessing at interest targeting.
Email marketing closes the gap that paid ads leave open. A Meta campaign might introduce someone to your brand, but if they don’t convert on the first visit, an automated email sequence triggered by that site visit can bring them back without spending another advertising dollar on retargeting.
Lead magnets and gated content give Meta campaigns somewhere useful to send cold traffic that isn’t ready to buy yet. Building an AI-powered lead magnet that captures an email address turns a cold Meta click into a warm contact you can nurture over weeks, rather than a wasted impression.
Analytics platforms like Google Analytics 4 and server-side tagging setups tie the whole system together, letting you see the full path a customer took across both platforms instead of crediting the last click. Without that connective layer, you’re making six-figure budget decisions based on two dashboards that don’t talk to each other.
What Mistakes Do Businesses Make Choosing Between Google Ads and Facebook Ads?
The most common mistake is picking a platform based on where competitors advertise rather than where a business’s own buyers actually search or scroll. A B2B software company copying a DTC brand’s Meta-heavy strategy usually burns budget on an audience that was never going to convert without search intent behind it.
The second mistake is comparing CPC across platforms and calling it a day. As covered above, a lower cost per click means nothing if the conversion rate behind it is worse, comparing CPA and ROAS is the only fair fight.
A third, quieter mistake: launching a campaign on either platform with a weak landing page and blaming the ad platform when conversions don’t show up. On Google, a page that doesn’t match the search query’s intent tanks Quality Score and inflates CPC. On Meta, a slow or confusing page wastes the attention that good creative just earned. Fixing the landing page is often the highest-leverage change available, and it’s the one most businesses skip in favor of tweaking ad copy instead.
Finally, businesses often judge results too fast, calling a Meta campaign a failure after three days when the algorithm hasn’t exited its learning phase, or killing a Google campaign after a week when Quality Score is still stabilizing. Both platforms need real data volume before the numbers mean anything.
Why Budget Allocation Beats Platform Loyalty
The conventional advice on Google Ads versus Facebook Ads treats this like a permanent choice, pick your platform, commit, defend it in board meetings. That framing misses what the cost data actually shows: the CPC gap between platforms is a distraction, and the real signal sits in CPA and ROAS, which shift by business type, not by platform allegiance.
What’s underrated is how much a landing page decides the outcome before the ad platform gets any credit at all. A Google campaign lives or dies on keyword-to-page relevance. A Meta campaign lives or dies on whether the creative earns attention long enough to reach that page. Businesses obsess over targeting settings and audience overlap when the page they’re sending traffic to is often the weakest link in the chain.
Prioritize this first: run the search-volume and creative-capacity audit before touching a budget slider. The platform with more existing demand for your product usually deserves the larger starting share, and every allocation after that should move based on measured CPA, not conviction.
Get a Data-Driven Ad Platform Audit From Envisionmarketingagency
Choosing between Google Ads and Facebook Ads gets a lot easier when someone else is already tracking CPA, ROAS, and landing page performance across both platforms for you. That’s the gap Envisionmarketingagency fills: unified measurement, PPC management, creative production, and landing-page optimization under one team, instead of guessing which platform’s dashboard to trust.
Rather than pitching one platform over the other, Envisionmarketingagency starts every engagement with the same audit outlined above, search volume, creative capacity, tracking readiness, and current landing page performance, before recommending a starting split. That’s the difference between an agency selling a service and one building a plan around your actual buyer journey.
If you’re ready to see where your budget should actually go, request a platform audit and consultation and get a concrete allocation recommendation instead of another generic pitch deck.
Frequently Asked Questions
Which is better, Google Ads or Facebook Ads?
Neither is universally better. Google wins when customers are actively searching for what you sell; Meta wins when you need to create awareness for a product people haven’t discovered yet. The right answer depends on your buyer’s journey stage.
Is Facebook advertising cheaper than Google Ads?
Facebook’s average CPC tends to run lower, roughly $0.62 to $1.72 versus Google’s $2 to $5, but a lower CPC doesn’t guarantee a lower cost per acquisition. Conversion rates often favor Google’s higher-intent traffic.
Can I run Google Ads and Facebook Ads at the same time?
Yes, and doing so often compounds results. Meta campaigns tend to lift branded search volume, which Google then captures at a lower cost per acquisition than cold prospecting alone would achieve.
How much budget do I need to test both platforms?
A reasonable starting test runs $1,000 to $1,500 per platform over 30 days, enough to generate the conversion volume needed for a reliable CPA read.
What metric should I use to compare Google Ads and Facebook Ads performance?
Cost per acquisition and return on ad spend are the only metrics that translate fairly across platforms. Click-through rate and CPC vary too much by platform mechanics to serve as a fair comparison.
Sources
- Google Ads vs Facebook Ads — Shopify
- Facebook Ads vs Google Ads: Which Is Better in 2026? — Superscale
- Google Ads Vs. Meta Ads In 2026 — Groas