

Instagram ads typically cost between about $0.40 and $2.00 per click and between roughly $2 and $10 per thousand impressions in 2026, with cost per action varying according to your industry. Raw CPC and CPM numbers matter less than most advertisers think. The real planning tool is your break-even CPA, set before you spend a dollar, because whatever your cost per click looks like today, only cost per action tells you whether the campaign makes money.
TL;DR:
- Campaigns should prioritize destination-link CPC over all-click CPC, as only the former reflects true costs for meaningful actions.
- Start testing with $10 daily budgets and scale up only after confirming stable CPA and ROAS, especially during Q4 when costs tend to rise.
- Creative quality, placement mix, and audience definition have the greatest impact on ad costs, with landing page conversion rate affecting CPA more than inside the ads.
- Typical costs range from $0.40 to $2.00 CPC, $2 to $10 CPM, and $15 to $60 CPA, depending on optimization and industry, but CPM alone is not a reliable cost indicator.
- Focus on fully loaded ROAS and LTV to CAC metrics for scaling decisions, and consider agency support once spending exceeds a few thousand dollars monthly.
Table of Contents
- Key Takeaways for Your Instagram Ads Budget
- What Do Instagram Ads Actually Cost in 2026?
- How Do You Set an Instagram Ads Budget That Actually Works?
- What Factors Actually Drive Your Instagram Ad Costs?
- Reels, Feed, or Stories: Where Should Your Budget Go?
- How Do You Lower Costs and Actually Improve ROAS?
- The Formulas Behind Every Instagram Ad Budget
- How Envision Marketing Agency Approaches Instagram Ad Budgeting
- Should You Run Instagram Ads Yourself or Hire an Agency?
- Get a Practical Instagram Ads Strategy Built Around Real Numbers
- Where These Instagram Ad Cost Benchmarks Come From
- Sources
Key Takeaways for Your Instagram Ads Budget
Before you touch the ad manager, get these numbers straight in your head.
- Plan around destination-link CPC, not all-click CPC. All-click figures blend in likes, comments, and profile visits, which inflates apparent efficiency and hides your real cost per meaningful action.
- Start small and specific: $10/day works for a bare-minimum signal test, $25 to $50/day gets you usable learning data, and $100+/day lets you scale a proven creative fast.
- Expect a spike in Q4 CPM and CPC as retailers compete for the same inventory around Black Friday and the holidays. Budget higher or scale back testing volume in November and December.
- The three levers that move your cost more than anything else are creative quality, placement mix, and how tightly (or loosely) you’ve defined your audience.
- Landing page conversion rate often has a bigger effect on your effective CPA than anything you do inside the Ads Manager itself.
What Do Instagram Ads Actually Cost in 2026?
Benchmark numbers vary by source because platforms track slightly different things, but the ranges converge enough to plan around. WordStream’s 2026 synthesis puts CPC between $0.40 and $2.00, CPE between $0.03 and $0.08, and CPM between $2 and $6 for campaigns that are performing well. Separately, AdLibrary’s 2026 benchmark data reports CPM running $6 to $10, CPC $0.40 to $1.80, and CPA anywhere from $15 to $60 depending on the vertical.
The gap between those CPM ranges isn’t a contradiction. It reflects the difference between a well-optimized account with strong creative and a typical account still working through the learning phase. Your own number will land somewhere in that spread depending on how good your ad actually is.
The metric you should almost never plan around is CPM. It tells you what you’re paying for reach, not whether that reach converts. A campaign with a $3 CPM and terrible creative will cost you more per sale than an $8 CPM campaign with a great hook and a fast landing page.
Here’s how the main metrics break down and what each one is actually good for:
| Metric | Typical range | What it tells you | Best used for |
|---|---|---|---|
| CPC (destination link) | $0.40–$1.80 | Cost per click to your site or app | Traffic and conversion campaigns |
| CPC (all-click) | Often lower than link CPC | Cost per any interaction, including likes/comments | Awareness only, not for planning |
| CPM | $2–$10 | Cost per 1,000 impressions | Comparing placement efficiency |
| CPE | $0.03–$0.08 | Cost per engagement (like, comment, save) | Engagement or community-building goals |
| CPA | $15–$60 | Cost per completed conversion event | Bottom-line budgeting, ROAS math |
Statistic to remember: the CPC range that matters for budgeting purposes, $0.40 to $2.00, comes from destination-link clicks, not the vanity all-click number many dashboards show by default. If your reporting tool defaults to all-click CPC, switch the column before you make any spending decisions.
Which number should you actually watch week to week? If your objective is sales or leads, track CPA and cost per landing page view, not CPC or CPM. If your objective is brand awareness, CPM and reach frequency are the right lens. Mixing up which metric matters for which objective is one of the most common budgeting mistakes advertisers make.
How Do You Set an Instagram Ads Budget That Actually Works?
Two formulas do most of the heavy lifting here. Break-even CPA equals your average order value multiplied by your contribution margin. If you sell a $60 product with a 40% margin, your break-even CPA is $24. Spend any more than that per conversion and you’re losing money on that sale before accounting for overhead. Break-even ROAS is the inverse: divide 1 by your contribution margin percentage.
Run the math on a real scenario. Say your Instagram campaign generates clicks at $0.90 each with a 3% landing page conversion rate. That works out to roughly $30 per conversion, a CPA that’s fine against a $24 break-even threshold only if your margin assumptions were conservative or if repeat purchases push lifetime value higher. This is exactly why full-cost budgeting frameworks tell you to account for media spend, creative production, management time, and landing page or tracking tools, not just the number in the ads manager.
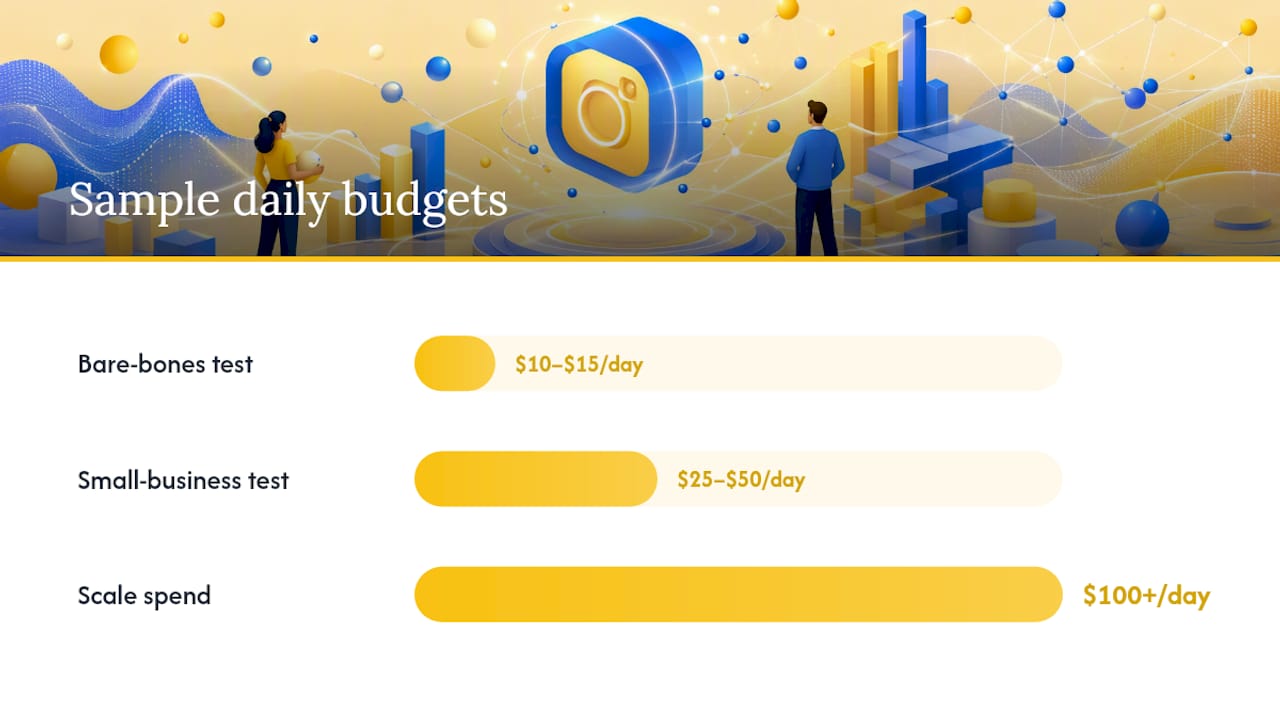
Sample daily budgets for a 30-day test cycle:
- $10 to $15/day gets you a bare-bones signal test, mostly useful for validating that an audience isn’t wildly off target.
- $25 to $50/day is the sweet spot for most small businesses testing 2 to 3 creative variants, generating enough data within two to three weeks to make a real decision.
- $100+/day suits businesses ready to scale a creative that’s already proven itself, moving fast through the learning phase toward stable, repeatable costs.
Whatever tier you start at, budget for the learning phase itself. Meta’s algorithm needs a rolling set of roughly 50 optimization events per week for your chosen conversion action before performance stabilizes. Spend that’s spread too thin across too many ad sets starves each one of the data it needs.
What Factors Actually Drive Your Instagram Ad Costs?
Every dollar you pay in the Instagram auction gets shaped by a handful of variables, and most advertisers only ever diagnose one or two of them.
- Campaign objective and optimization event. Optimizing for a purchase event costs more per click than optimizing for traffic, because you’re asking the algorithm to find a harder, rarer action.
- Audience pressure. Targeting an audience of 50,000 people in a competitive niche during a high-demand season will always cost more than targeting a broader, less-contested pool.
- Creative relevance. Meta’s system estimates how likely someone is to engage with your ad, and a low predicted engagement rate quietly taxes you with a higher effective cost.
- Placement mix. Where your ad shows up (Reels, Feed, Stories, or all three) changes both your CPM and your realistic CPA.
- Seasonality. Retail-heavy periods and major shopping events push demand for the same inventory upward across the board.
- Account maturity. New accounts with no conversion history pay a kind of inexperience tax while the algorithm is still learning who converts for you.
Diagnosing which factor is inflating your costs starts with elimination. If CPM is high but CTR is strong, seasonality or audience overlap is likely the culprit. If CPM is normal but CPA is high, the problem usually sits downstream, in your creative relevance or your landing page.
Reels, Feed, or Stories: Where Should Your Budget Go?
Placement changes your cost profile more than almost any other single decision you’ll make in the ads manager. Reels inventory tends to run 30% to 50% cheaper on CPM than Feed because Meta has more Reels ad slots available relative to demand. That cheaper reach comes with a catch: people scrolling Reels are in a passive, entertainment mindset, so purchase intent runs lower and your CPA can end up higher even when your CPM looks great.
Feed placements cost more per thousand impressions but tend to convert better for direct-response campaigns, because users browsing Feed are more likely to be in a decision-making frame of mind. Stories sit in between on both cost and intent, and they work well for retargeting audiences who already know your brand.
A practical split: use Reels for top-of-funnel awareness and video view campaigns, Feed for direct conversion campaigns, and Stories for retargeting warm audiences with a clear offer.
Creative quality has an outsized effect on cost regardless of placement. The first one to two seconds of a Reels ad determines whether someone keeps watching or scrolls past, and that early hold time feeds directly into the auction’s relevance score, which can lower your effective CPM by a meaningful margin within days of a creative refresh.
Automatic placements, what Meta calls Advantage+ placements, let the algorithm spread your budget across Facebook and Instagram surfaces based on where conversions are actually happening. Meta’s own guidance confirms this increases placement liquidity and can reduce costs, but only once your account has enough conversion volume for the system to learn from. Turn it on too early, with too little data, and you risk the algorithm making decisions on noise rather than signal.
- Reels: cheapest reach, best for awareness and video views.
- Feed: pricier but higher purchase intent, best for direct response.
- Stories: middle ground, strong for retargeting.
- Advantage+ placements: worth testing once you have steady weekly conversions, not before.
Pro Tip: Swap your Reels opening frame for something with motion or a human face in the first second, then check CPM after 3 to 4 days. That single change is often the fastest, cheapest lever you have for cutting cost per thousand impressions.
How Do You Lower Costs and Actually Improve ROAS?
Cutting your Instagram ad spend without gutting results comes down to a short list of moves, applied in the right order.
- Run a structured creative test every one to two weeks. Test 3 to 5 creative variants per audience over a 7 to 14 day window, and make sure your daily budget can generate at least 50 optimization events for your target conversion action within that period, or the results won’t be statistically meaningful.
- Start broad, then layer retargeting. Broad audiences give Meta’s algorithm more room to find your best customers; narrow retargeting segments come in after you’ve built a pixel or conversion dataset worth targeting against.
- Fix your landing page before you fix your ads. A page that loads slowly or buries the offer below the fold can double your effective CPA even with perfect targeting. Small conversion rate optimization fixes, like a clearer headline or a faster load time, often move ROAS more than another round of ad tweaks.
- Separate your testing budget from your scaling budget. A common mistake is spending your entire budget testing five audiences at once, none of which get enough data to prove anything.
- Switch to Advantage+ only once conversion volume supports it. Below roughly 50 conversions a week, manual campaigns with clear, defined audiences tend to outperform automated ones; above that threshold, Advantage+ usually starts shifting budget toward your best-performing placements on its own.
If your Instagram results feel stuck, the diagnostic checklist in our piece on why Facebook ads stop working applies almost identically here, since both platforms share the same underlying auction and creative fatigue patterns.
The Formulas Behind Every Instagram Ad Budget
You don’t need a finance degree to run these numbers, just five formulas and a calculator.
- CPM = (Total spend ÷ Impressions) × 1,000
- CPC = Total spend ÷ Clicks
- CPE = Total spend ÷ Engagements
- CPA (or CPL) = Total spend ÷ Conversions (or leads)
- ROAS = Revenue generated ÷ Ad spend
Worked example: your campaign spends $500, earns 550 clicks at roughly $0.90 CPC, and converts at 3%. That’s about 16.5 conversions, putting your CPA near $30.
If CPA sits above break-even for more than a few days past the learning phase, pause and diagnose creative or landing page issues before spending further.
How Envision Marketing Agency Approaches Instagram Ad Budgeting
Envision Marketing Agency treats Instagram ad spend the same way it treats every paid channel: staged, measured, and tied to qualified leads rather than vanity engagement numbers. Campaigns typically launch with a controlled testing budget designed to hit a meaningful sample size within two to three weeks, then scale only once CPA and ROAS both hold steady across that data.
That staged approach matters because most accounts fail not from bad creative but from scaling too early, before the algorithm or the advertiser actually knows what’s working. Since 2020, this data-first discipline has shaped how Envision manages paid social for more than 550 clients across industries where the margin for wasted spend is thin.
[Marcus’s professional bio and credentials]
[Case studies or client results authored or provided by Marcus]
Should You Run Instagram Ads Yourself or Hire an Agency?
Here’s my honest read after digging through these numbers: most small businesses can run a decent Instagram ads test on their own. Where DIY breaks down is scale. Once you’re spending more than a few thousand dollars a month, juggling creative testing, tracking setup, and cross-channel attribution against Google Ads at the same time, the hours add up faster than the returns.
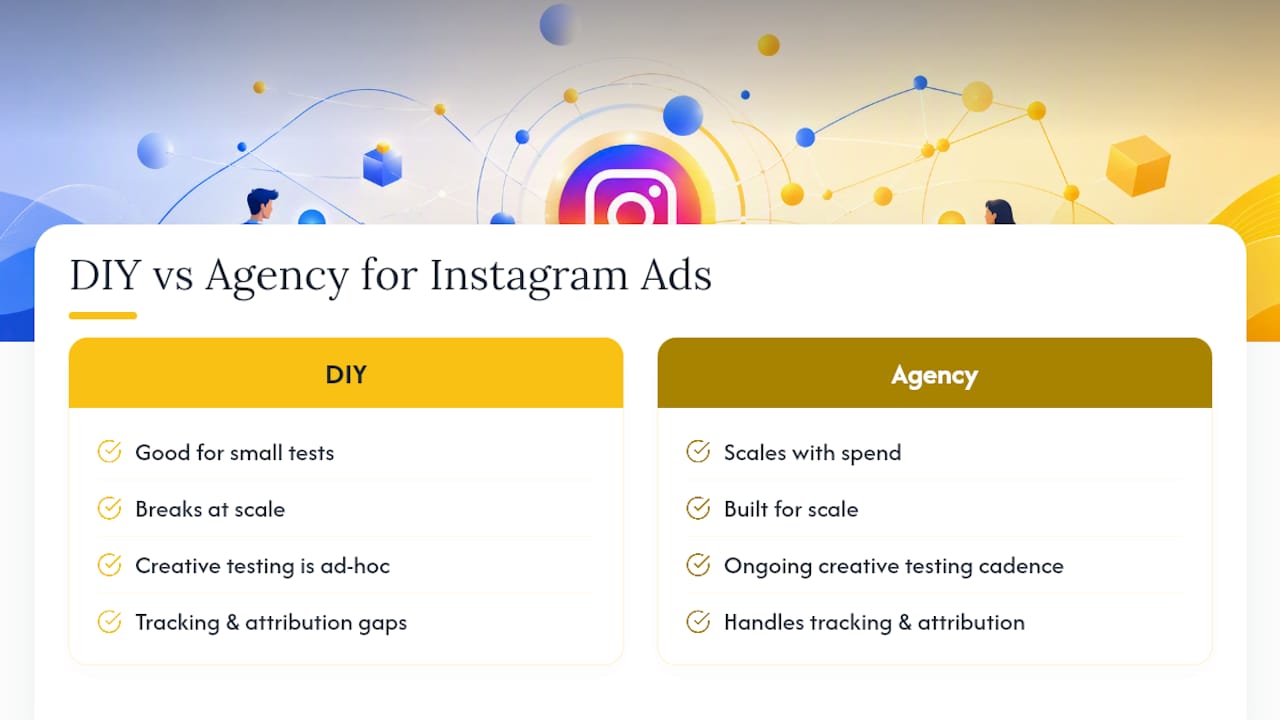
The clearest signal it’s time to bring in help isn’t budget size alone, it’s measurement gaps. If you can’t confidently say what your fully loaded ROAS looks like after accounting for creative production and management time, or you don’t know your LTV to CAC ratio, you’re flying blind regardless of how good your CPC looks.
An agency engagement typically handles three things a solo marketer struggles to do simultaneously: ongoing creative testing cadence, tracking and attribution setup, and the discipline to pause underperforming campaigns instead of hoping they recover. Evaluate any agency relationship the same way you’d evaluate your own campaigns, on fully loaded ROAS and LTV to CAC, not on cost per click.
— Marcus
Get a Practical Instagram Ads Strategy Built Around Real Numbers
Envision Marketing Agency is the alternative to guessing your way through Instagram ad spend. Instead of testing blind and hoping a low CPC turns into profit, our team builds campaigns around your actual break-even CPA from day one, then pairs paid social with conversion rate optimization so the traffic you’re paying for actually converts once it lands.
[Case study placeholder: client Instagram ad results managed by Envision]
If your current campaigns are burning budget without a clear CPA target, Envision’s managed social media ad services can audit what’s driving your costs and build a testing plan around numbers you can actually defend to a business owner. Request a proposal through our managed marketing services page and get a straight answer on what your Instagram budget should look like next month.
Where These Instagram Ad Cost Benchmarks Come From
The ranges and rules in this guide draw from a handful of sources that track paid social performance closely.
- WordStream’s Instagram ads cost guide supplies the core CPC, CPE, and CPM benchmark ranges for well-optimized campaigns.
- AdLibrary’s 2026 Instagram advertising cost benchmarks break down placement-level CPM differences and industry-specific CPA ranges.
- Invideo’s Instagram ads ROI playbook informs the starter budget recommendations and learning-phase testing cadence.
- Hootsuite’s Instagram ads guide covers the seasonality effects that drive Q4 cost spikes.
- Meta’s own placement and optimization guidance explains how automatic placements affect delivery and cost.
- Zeely’s Instagram ad cost and budget breakdown grounds the break-even CPA formula used throughout this piece.
Sources
- How Much Do Instagram Ads Cost? Pricing & Budget (WordStream)
- Instagram Advertising Costs in 2026: CPM, CPC & CPA Benchmarks (AdLibrary)
- Instagram Ads in 2026: A Practical ROI Playbook | Invideo
- Hootsuite Instagram ads guide (seasonality insight)